Biological age from a CT scan, an ECG or an X-ray: what the new age models measure
Models can now estimate an "age" from a CT scan, a chest X-ray, an ECG or a photo of the retina. An older-looking result has been linked to higher disease and death risk, but only as an association, in specific populations, and with no evidence that changing the number helps.
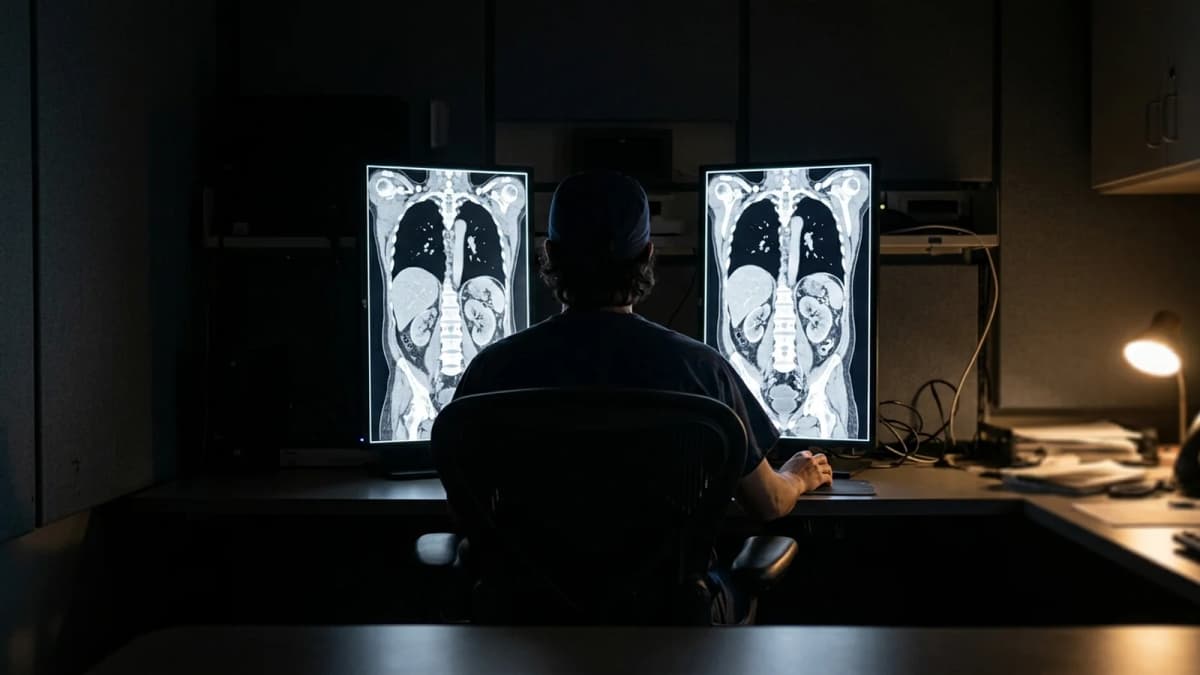
You may have had a chest X-ray, an ECG or a CT scan for some unrelated reason, and then read that a computer can estimate your "biological age" from the same images. A study published in September 2026 did exactly that with CT scans of the chest and abdomen. So what does such a number capture, and what can it not tell you yet?
This article goes through what these image- and signal-based age models have measured, in whom, and what is still missing.
This material is for information only and does not replace a consultation with a doctor. Tests and their interpretation are decided together with a clinician who knows your situation.
How does a scan turn into an age?
The setup is similar across studies. A model is trained on many examinations from people whose real age is known, and it learns which features change with age. Applied to a new person, it outputs a predicted age. The difference between the predicted age and the real age is called the age gap; some studies, including the CT study below, use an age-adjusted version of that difference. A positive gap means the examination looks "older" than is typical for that age in the people the model learned from.
This is a different family from the clocks described in our article on how biological age is calculated, which are built from blood tests or DNA methylation. Here the input is an image or an electrical recording.
What did the new CT study find?
The researchers used chest-and-abdomen CT scans from 7,837 community-dwelling adults aged 30 and over in a prospective health-screening programme at the University of Tokyo, scanned between 2006 and 2017 and followed through 2021. The median age was 54, and 63.8% were men. The model read body composition across several organs and was trained on healthy people to describe "normal" ageing.
In the healthy development group, predicted age matched real age moderately: R² was 0.66 and the average error was 4.7 years.
Each one-standard-deviation increase in the age gap was associated with higher odds of already having an age-related disease among people who had one at the scan (odds ratio 1.35) and, in a separate group free of those diseases at the first scan, with a higher risk of developing one during follow-up (hazard ratio 1.24).
Unhealthy lifestyle factors were associated with a larger gap.
What does that mean in practice? A person whose scan looked older than expected was, on average, somewhat more likely to have or to develop an age-related disease. These are associations from one research group's model. Both test groups came from the same source population, so the authors note this is not external validation. The study did not test whether anything that changes the gap changes those risks. The authors write that the method should not be used as a stand-alone screening tool, because CT involves radiation, and that it needs prospective validation in diverse populations before routine clinical use.
Is this new, or have other tests done the same?
The idea is several years old, and it has been tried on most routine examinations:
Chest X-ray. A model trained on X-rays from 116,035 people was tested in two large US cancer-screening trials. In the larger test set (40,967 people), five years of "X-ray age" carried a higher risk of death from any cause (hazard ratio 2.26) than five years of real age (1.77). Results were similar in the second trial.
ECG. A Mayo Clinic model trained on ECGs from 499,727 patients was tested on a separate 275,056 patients, where the average error in age was 6.9 years. In 25,144 primary-care patients aged 30 and over, without known coronary disease, stroke or atrial fibrillation and followed for about 12 years, an ECG age at least one standard deviation above real age was associated with higher all-cause and cardiovascular mortality. In a Brazilian cohort of 1,558,415 patients, a held-out 15% showed that an ECG age more than 8 years above real age was associated with higher mortality (hazard ratio 1.79), and one more than 8 years below with lower mortality (0.78).
Retina. In the UK Biobank, a model reading fundus photographs estimated age with an average error of 3.55 years. Each extra year of "retinal age gap" was associated with a 2% higher risk of death from any cause, and there was no significant association with cardiovascular or cancer deaths.
Brain MRI. In 669 older adults from a Scottish birth cohort, an older-looking brain was associated with weaker grip, poorer lung function, slower walking and a higher risk of death.
A related line of work skips the "age" and keeps the measurements. In 9,223 adults without symptoms who had an abdominal CT for colorectal cancer screening, automated measures of aortic calcification, muscle density, the visceral-to-subcutaneous fat ratio, liver density and vertebral bone density all differed between people who later had a serious cardiovascular event or died and those who did not. For predicting death, aortic calcification did better than both body mass index and the Framingham risk score, and combining several CT measures improved prediction over clinical parameters.
What do these numbers not tell you?
They show association, not cause. Every study above is observational. None tested whether improving an age gap changes how long or how well people live. "People whose X-ray looks older die earlier on average" does not mean that making the X-ray look younger would help.
A gap compares you with the people the model learned from. Each model comes from a particular group: a single-centre Japanese health-screening cohort for CT; an X-ray model tested in two US cancer-screening trials; Mayo Clinic patients, 95% described as Caucasian in the long-term ECG cohort; a Brazilian ECG cohort; UK Biobank volunteers; and the Lothian Birth Cohort 1936 in Scotland. How well each model fits people of other origins, other hospitals and other scanners has to be shown separately for each.
The arithmetic of the gap has traps. A technical analysis of brain-age methods showed that the most common way of calculating the gap has problems, and proposed corrections. So a gap from one model is not automatically comparable with a gap calculated another way.
One body can have several "ages". A UK Biobank study built models for three brain systems and seven body systems and found that organs age unevenly. One number from one organ is not "the" biological age.
These are research tools, not tests to order. The CT and X-ray studies used images already taken for other purposes, such as screening. None of the studies proposes having a scan to find out your age, and the CT authors say so directly.
What should you do with the number?
If a scan report, a clinic or an app gives you an age estimated from an image or an ECG, treat it as a research signal, not a diagnosis. What changes decisions is usually the underlying finding, such as calcification in the arteries or the state of the liver, read together with blood pressure, lipids, glucose and your history, and this is discussed with a doctor. If you want to see how a gap between biological and real age is interpreted in general, see our article on the gap between biological and chronological age.
Sources
Yu Q, Hanaoka S, Nomura Y et al. CT-based biological age as a biomarker of aging and age-related disease assessment. npj Aging. 2026. DOI 10.1038/s41514-026-00523-1
Raghu VK et al. Deep learning to estimate biological age from chest radiographs. JACC Cardiovasc Imaging. 2021. PMID 33744131
Attia ZI et al. Age and sex estimation using artificial intelligence from standard 12-lead ECGs. Circ Arrhythm Electrophysiol. 2019. PMID 31450977
Ladejobi AO et al. The 12-lead electrocardiogram as a biomarker of biological age. Eur Heart J Digit Health. 2021. PMID 36713596
Lima EM et al. Deep neural network-estimated electrocardiographic age as a mortality predictor. Nat Commun. 2021. PMID 34433816
Zhu Z et al. Retinal age gap as a predictive biomarker for mortality risk. Br J Ophthalmol. 2023. PMID 35042683
Cole JH et al. Brain age predicts mortality. Mol Psychiatry. 2018. PMID 28439103
Pickhardt PJ et al. Automated CT biomarkers for opportunistic prediction of future cardiovascular events and mortality in an asymptomatic screening population. Lancet Digit Health. 2020. PMID 32864598
Smith SM et al. Estimation of brain age delta from brain imaging. Neuroimage. 2019. PMID 31201988
Tian YE et al. Heterogeneous aging across multiple organ systems and prediction of chronic disease and mortality. Nat Med. 2023. PMID 37024597
Articles in this section are educational and are not medical advice, a diagnosis, or a prescription. Consult a qualified professional before acting on anything you read here.
Read next
 ResearchBiomarkers
Intervals or steady cardio: what head-to-head trials found for VO2max
Short hard intervals or long steady sessions? In healthy adults both raised VO2max, intervals by about 1.2 ml/kg/min more. In heart disease the big early gap shrank or vanished in larger trials, and no trial has shown that the choice changes survival. What was measured, in whom, and what it does not say.
10 min read ResearchMedicine and treatment
Daily multivitamins for years: what the large randomized trials found
Two large trials followed people on a daily multivitamin for 3.6 and 11.2 years. Cancer incidence was slightly lower in older men but not in the trial that included women; heart attacks, strokes and deaths did not change; memory results disagree. What the data say about taking vitamins all year round.
11 min read ResearchMedicine and treatment
mRNA vaccines after COVID: what the flu, RSV and cancer trials measured
A seasonal mRNA flu shot measured against the standard-dose vaccine, an RSV dose whose efficacy fell as follow-up lengthened, and two cancer programmes that were only ever given after surgery. What each trial measured, in whom, and over how long.
8 min read