Body composition instead of weight: how it is measured, how accurate the methods are, and which numbers change decisions
BMI misses about half of people with excess body fat, different bioimpedance devices diverge from DXA by several percentage points, and DXA itself has day-to-day noise. Which body composition measurements actually change decisions — waist, a series on one device, strength before mass — and what is proven versus merely associated.
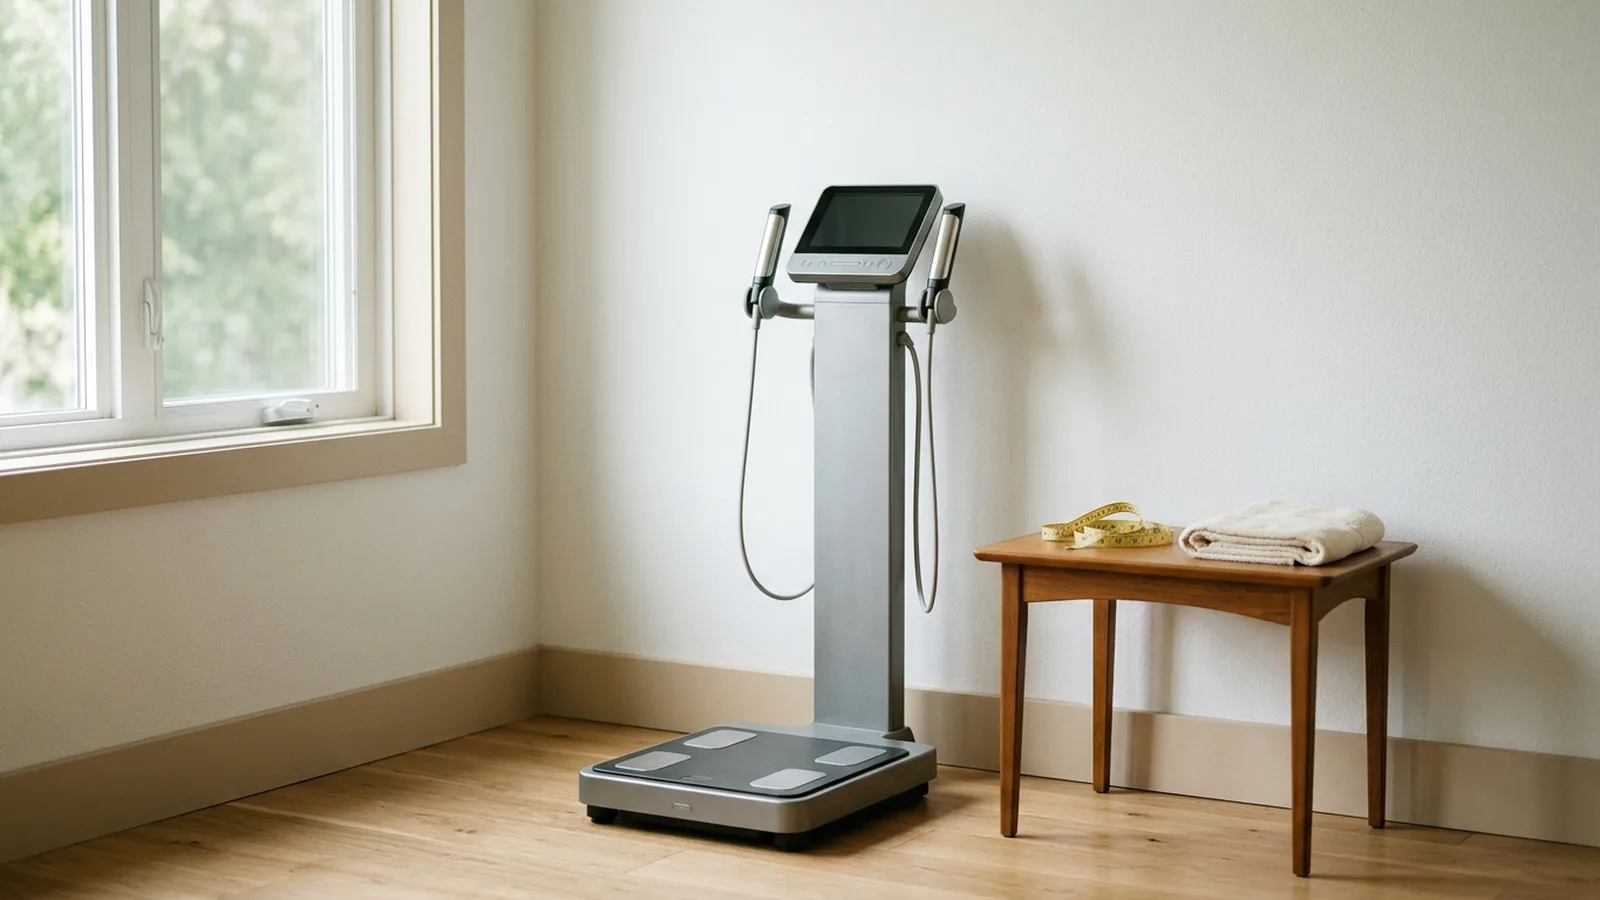
Body weight is a single number that adds everything up at once: fat, muscle, bone, water. Body mass index (BMI) divides that number by height squared and remains the most common way to say "excess weight" or "no excess weight". But health decisions are not made about kilograms — they are made about what those kilograms are made of and where they sit. This article covers how body composition is measured, how accurate those methods are, and which of the resulting numbers actually change decisions.
Why it matters where fat sits is covered in our piece on waist-to-height ratio; why muscle mass is a reserve rather than cosmetics is covered separately.
What BMI misses
A 2010 systematic review and meta-analysis pooled 25 studies (32 samples, almost 32,000 people) that compared BMI against reference methods for estimating body fat percentage. Commonly used BMI cutoffs turned out to be specific but insensitive: pooled sensitivity 0.50, specificity 0.90. In other words, BMI missed roughly half of the people with excess body fat, while most people without excess fat were correctly not labelled as obese. For the cutoff of 30, sensitivity was even lower — 0.42.
The miss has a name: normal-weight obesity. In the US NHANES III sample (6,171 adults with a normal BMI, median follow-up 8.8 years), the third with the highest body fat had four times more metabolic syndrome (16.6% vs 4.8%), and women in this group had a 2.2-fold higher risk of cardiovascular death. This is an observational association: it says BMI hides differences in risk, not that lowering body fat percentage by itself removes that risk.
Waist: the simplest measurement that changes the most
In a pooled analysis of 11 cohorts (650,000 adults, white populations, median follow-up 9 years), waist circumference was associated with mortality at every BMI from 20 to 50: each 5 cm added about 7% to the risk in men and 9% in women. The comparison of extreme groups (≥110 vs <90 cm in men, ≥95 vs <70 cm in women) corresponded to a difference in life expectancy of roughly 3 and 5 years. Again, this is an association, not proof that a smaller waist gives those years back.
Two documents follow from this and change practice. The 2020 consensus statement of the IAS and ICCR Working Group on Visceral Obesity proposes treating waist circumference as a "vital sign", measuring it routinely alongside BMI, and regarding a reduction in waist circumference as an important treatment target. And the 2025 Lancet Diabetes & Endocrinology Commission on clinical obesity recommends using BMI only for screening and at population level: excess adiposity in an individual should be confirmed by direct measurement of body fat or by at least one anthropometric criterion — waist circumference, waist-to-hip ratio or waist-to-height ratio — in addition to BMI. The exception is a BMI above 40, where excess adiposity can be assumed without further confirmation.
Bioimpedance: convenient, but an estimate rather than a measurement
Bioelectrical impedance (BIA) devices — from bathroom scales with foot electrodes to standing units with hand and foot electrodes — pass a weak current and calculate fat and fat-free mass from resistance using each device's own algorithms. Both kinds of error therefore matter: systematic bias, which depends on the device and the person, and wide individual scatter.
In 168 Finnish adults aged 37–81, two eight-electrode devices (the multifrequency InBody 720 and the single-frequency Tanita BC-418 MA) gave body fat percentages on average 2–6 percentage points lower than DXA — in women across all BMI categories and in normal-weight men; in men with obesity the gap was smaller.
In 226 adults aged 18–80, one eight-electrode multifrequency device matched DXA on average (−0.3 points), while another underestimated body fat by 3.1 points, most of all in normal-weight people. Limits of agreement for an individual ran from about −9 to +3 and from −8 to +7 points.
In 121 healthy adults (mean age 28, mean BMI 22.7), bioimpedance underestimated body fat by 5.6 points on average and overestimated fat-free mass by 2.9 kg — despite a correlation with DXA above 0.93. A high correlation here does not mean the numbers agree.
In 106 adults, consumer foot-to-foot devices had the widest limits of agreement — up to −14.5 to +8.6 points of body fat for an individual; a device with hand and foot electrodes, about −6.6 to +4.6.
What throws the reading off? In a study of 55 healthy young adults, food and drinks shifted the body fat estimate on a foot-to-foot device only slightly — a median of about 1% of the baseline value, within the method's own imprecision. In 18 trained students, a multifrequency device gave more reproducible results in the morning than in the evening, and the smallest change that could be considered real ranged from 4% to 41% across indices.
The practical conclusion from this set of studies: for tracking, use the same device under conditions as similar as possible — preferably in the morning, in the same state. Even that does not guarantee accurate tracking of changes in muscle and visceral fat. And comparing a number from one device with a number from another, or with a paper that used DXA, means comparing biases.
Does bioimpedance track change?
This is a separate question, and the answer is more modest. In 19 adults with obesity who lost 9 kg on average over a year, bioimpedance estimated fat loss the same as DXA (7.0 vs 7.0 kg) and muscle loss closely (1.0 vs 1.4 kg). But it tracked an individual's changes in muscle mass and visceral fat noticeably worse than their current values, and it overestimated visceral fat compared with MRI. The sample is small, and carrying it over to other people and devices calls for caution.
DXA: more precise, but not noise-free
Dual-energy X-ray absorptiometry (DXA) is a standard method for estimating fat mass, lean soft tissue mass and bone mineral, including by body region. On one modern scanner, in non-obese adults, repeat-scan precision was about 1% for fat mass and 0.5% for lean mass. But those figures come from two scans on the same day. In 21 resistance-trained athletes, the error between scans on different days was almost twice as large for fat (about 1.3 kg vs 0.7) and more than three times larger for lean mass (about 2.1 kg vs 0.6): ordinary day-to-day variation of the body adds to the technical error.
DXA also estimates visceral fat, but this is a calculation over the abdominal region rather than a direct image of the internal organs. Compared with MRI in 237 adults in Kuwait, the correlation was high (0.93–0.94), but limits of agreement for an individual were wide, on the order of hundreds of cubic centimetres either way.
In its 2013 positions, the International Society for Clinical Densitometry (ISCD) acknowledged that few indications for body composition testing outside research have been described, because few interventions change depending on the result, and it examined specific scenarios — HIV therapy, sarcopenia, bariatric surgery, obesity.
Muscle: strength first, then mass
For the muscle side, the decision does not rest on a single mass figure. The European consensus EWGSOP2 (2019) puts low muscle strength first, uses muscle quantity and quality to confirm a diagnosis of sarcopenia, and treats poor physical performance as a sign of severe sarcopenia. The Asian Working Group for Sarcopenia (AWGS 2019) gives specific cutoffs: handgrip strength below 28 kg in men and 18 kg in women; height-adjusted appendicular muscle mass by DXA below 7.0 and 5.4 kg/m², by bioimpedance below 7.0 and 5.7 kg/m². The consensus sets separate cutoffs for DXA and bioimpedance — the numbers from these methods are not interchangeable. What grip strength does and does not predict is covered here.
Weight loss takes more than fat
The long-cited "quarter rule" — that roughly a quarter of lost weight is fat-free mass — is itself an estimate, and its origins are examined in a 2014 critical review: fat-free mass losses depend on duration, age, activity and measurement accuracy. In a DXA substudy of the SURMOUNT-1 trial of tirzepatide (160 adults with obesity or overweight, DXA at 72 weeks), about 75% of the weight lost was fat and 25% was lean mass — roughly the same in the drug and placebo groups, although the amount of weight lost differed sharply (21% vs 5%). This is not a law and not a forecast for any individual.
Can muscle be preserved during weight loss? In a randomised trial of 160 older adults with obesity who were losing weight, lean mass declined less in the resistance and combined training groups (by 2–3%) than in the aerobic-only group (by 5%); functional measures improved most with combined training. This is a result in older adults with obesity; other groups need to be studied separately.
What of this changes decisions
Within the same BMI, risk differs. In a cohort of 38,000 US male health professionals (aged 40–75, body composition estimated from anthropometric equations), higher fat mass was associated with higher mortality in a monotonic way, while the association for lean mass was U-shaped. In a pooled analysis of seven German cohorts (16,000 people, bioimpedance), a high fat mass index was associated with higher mortality and a high fat-free mass index with lower mortality. Both studies are observational.
What follows in practice:
Waist circumference is a simple, low-cost measurement that current recommendations add to BMI.
Bioimpedance is best read as a series of readings on the same device under the same conditions, not as an absolute number: the bias between devices is comparable to the difference you hope to see, and it may track an individual's muscle changes inaccurately.
DXA is more precise, but it too has day-to-day noise; a change smaller than the threshold calculated for that scanner cannot be reliably told apart from error.
For muscle, strength and function come first, and mass serves to confirm.
During weight loss, it is worth discussing with a doctor how to preserve muscle; whether regular body composition monitoring is needed depends on the situation — research has not shown that it improves outcomes for everyone losing weight.
In a personal record, these numbers are worth keeping side by side: weight, waist, results from the same device — a series of several points taken the same way shows direction better than a single latest value, although it does not remove the device's systematic error. What a summary can and cannot tell you is covered separately.
This material is for information only and does not replace a consultation with a doctor.
Articles in this section are educational and are not medical advice, a diagnosis, or a prescription. Consult a qualified professional before acting on anything you read here.
Read next
 ExplainerBiomarkers
Walking speed: what counts as a meaningful change, and what the trials on speeding it up found
The thresholds for a meaningful change in walking speed — 0.05 and 0.10 m/s — were derived on groups, while the test's own error between two visits reaches 0.50 m/s. What is known about slowing and speeding up over time, what dual-task walking adds, and why the best trial in the field reduced mobility loss without ever separating from the control arm on the short speed test.
15 min read ExplainerMedicine and treatment
Flat feet in children and adolescents: when to observe, when to treat, and what the evidence shows
In most children a flat foot is a shape, not a disease: the arch matures on its own in the first decade. What decides is whether the foot is flexible and whether it hurts. What the insole trials showed, how a rigid foot differs from a flexible one, when surgery is discussed at all, and what to ask the orthopaedic surgeon.
16 min read ExplainerBiomarkers
What limits VO2max — lungs, heart or muscles — and how accurate the estimates are
VO2max is often described as a measure of the lungs. In healthy people the ceiling is set mostly by how much oxygen the heart and blood can deliver; the lungs become the limit only in particular situations. What changes with age, and how accurate lab tests, formulas and watches are.
12 min read